Wanna find the limiting factor in I/O performance on an Intel Nehalem server app? Here’s one idea.
The Nehalem architecture looks like this:
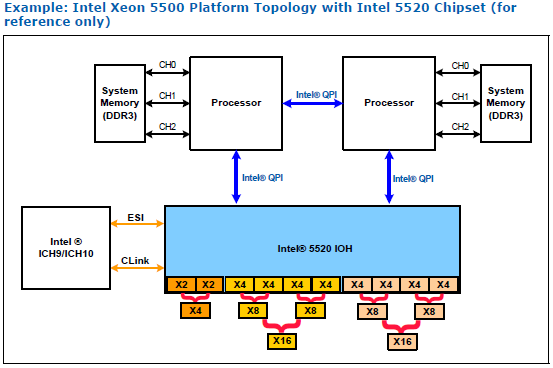
So the main potential bottlenecks are:
- RAM<->CPU @ approx 256Gbps to each CPU’s RAM bank. (Too many memory copies?)
- CPU<->CPU @ approx 200Gbps for sharing RAM over QPI. (NUMA all mucked up?)
- PCIe @ approx 72Gbps. (Out of ports? Crappy motherboard?)
- Storage disk/SSD. (Waiting all the time?)
Intel’s Performance Counter Monitor can tell you the utilization of these links. It’s like top for memory bandwidth, inter-processor data shuffling, PCIe load, etc. I used this tool for verifying that PCs can push 40Gbps of full-duplex ethernet traffic without any hassle. Intel make some really fine tech.
Give it a try! It’s really easy to install.
Here’s how it looks:
 EXEC  : instructions per nominal CPU cycle
 IPC   : instructions per CPU cycle
 FREQ  : relation to nominal CPU frequency='unhalted clock ticks'/'invariant timer ticks' (includes Intel Turbo Boost)
 AFREQ : relation to nominal CPU frequency while in active state (not in power-saving C state)='unhalted clock ticks'/'invariant timer ticks while in C0-state'  (includes Intel Turbo Boost)
 L3MISS: L3 cache misses
 L2MISS: L2 cache misses (including other core's L2 cache *hits*)
 L3HIT : L3 cache hit ratio (0.00-1.00)
 L2HIT : L2 cache hit ratio (0.00-1.00)
 L3CLK : ratio of CPU cycles lost due to L3 cache misses (0.00-1.00), in some cases could be >1.0 due to a higher memory latency
 L2CLK : ratio of CPU cycles lost due to missing L2 cache but still hitting L3 cache (0.00-1.00)
 READ  : bytes read from memory controller (in GBytes)
 WRITE : bytes written to memory controller (in GBytes)


 Core (SKT) | EXEC | IPC  | FREQ  | AFREQ | L3MISS | L2MISS | L3HIT | L2HIT | L3CLK | L2CLK  | READ  | WRITE

   0    0     0.59   0.60   0.98    1.00    1743 K   3978 K    0.56    0.62    0.15    0.07     N/A     N/A
   1    0     0.61   0.62   0.97    1.00    2595 K   3356 K    0.23    0.64    0.23    0.02     N/A     N/A
   2    0     0.49   0.59   0.83    1.00    2205 K   3198 K    0.31    0.60    0.22    0.03     N/A     N/A
   3    0     0.06   0.32   0.18    1.00     715 K    921 K    0.22    0.35    0.34    0.02     N/A     N/A
------------------------------------------------------------------------------------------------------------
 TOTAL  *     0.43   0.59   0.74    1.00    7259 K     11 M    0.37    0.61    0.21    0.04    6.51    2.85

 Instructions retired: 3707 M ; Active cycles: 6317 M ; Time (TSC): 2134 Mticks ; C0 (active,non-halted) core residency: 73.99 %

 PHYSICAL CORE IPC                 : 0.59 => corresponds to 14.67 % utilization for cores in active state
 Instructions per nominal CPU cycle: 0.43 => corresponds to 10.86 % core utilization over time interval
----------------------------------------------------------------------------------------------